Evaluation Metrics
Accuracy
- Overall correctness of the predictions.
- Higher Values = Better Performance.
- Misleading for imbalanced Dataset.
from sklearn.metrics import accuracy_score

accuracy = accuracy_score(y_true, y_pred)
print(f"Accuracy {accuracy}"
Classification
Confusion Matrix
- Used for classification, very popular for binary classifiers.
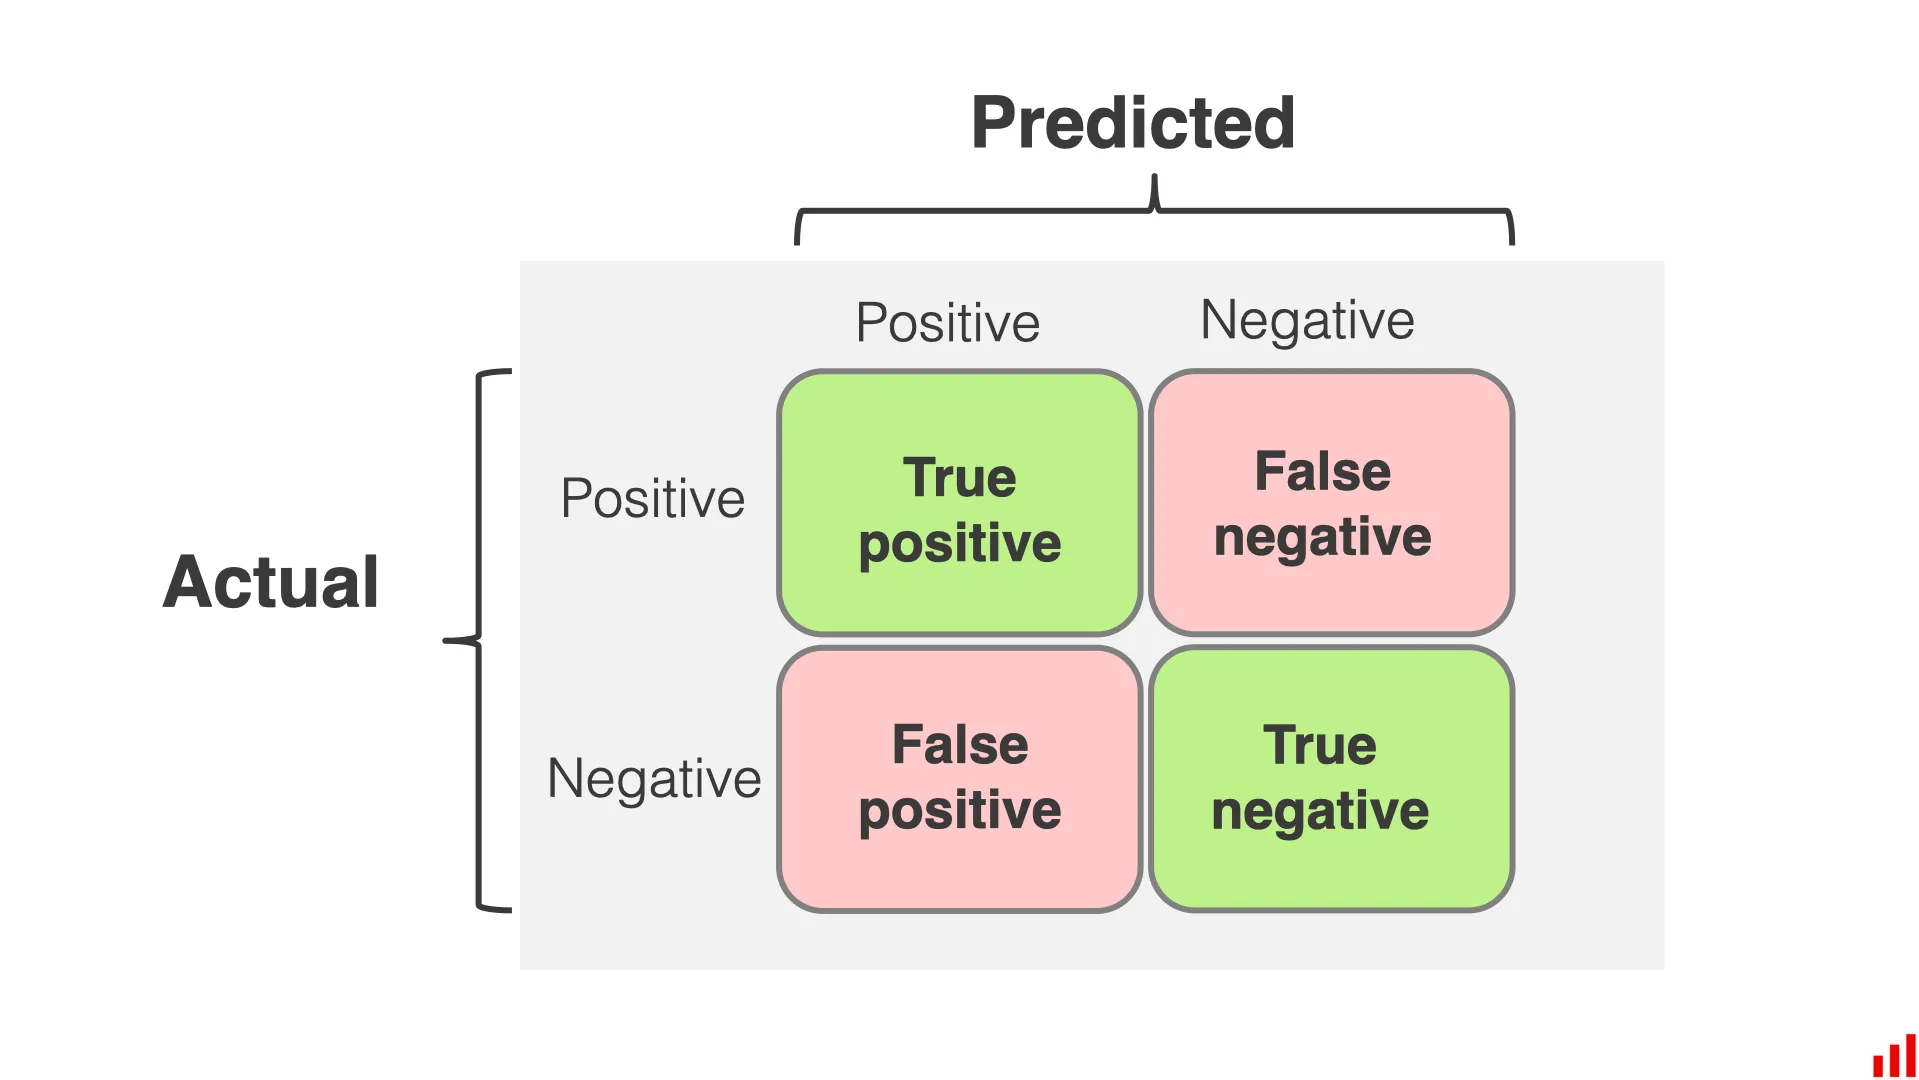
- This evaluates the number of Positives and Negatives, which are correctly and incorrectly predicted.
from sklearn.metrics import confusion_matrix, ConfusionMatrixDisplay

c_matrix = confusion_matrix(df['Actual Labels'], df['Predicted Labels'])
display_matrix = ConfusionMatrixDisplay(c_matrix, display_labels=['0', '1'])
display_matrix.plot()
plt.show()
Precision and Recall
- Precision Quantifies the model’s ability to identify only the relevant cases.
- “How many items are relevant”
- Recall quantifies the model’s ability to find all the relevant cases.
- “How many items are relevant?”
- These are bad for imbalanced datasets.
F1 Score
- A combination of precision and recall.
- This is the harmonic mean of precision and recall, because that doesn’t give an unfair weight to extreme values.
- The higher the F1 score more is the predictive power of the classification model. A score close to 1 means a perfect model, however, score close to 0 shows decrement in the model’s predictive capability.
Sensitivity and Specificity
- True Positive Rate (TPR / Sensitivity): measures the proportion of positive instances correctly classified by the model.
- True Negative Rate (TNR / Specificity): It is the proportion:
- False Positive Rate (FPR / 1 - Specificity):
ROC Curves
- Receiver Operation Characteristic (ROC) is a graphical representation to evaluate Binary Classification.
- The ROC curves plot the graph between True positive rate and false-positive rate
AUC-ROC
- Looks at area under the curve, at different thresholds
- AUC is considered to be scaled variant, it measures the rank of predictions rather than its absolute values
- AUC always focuses on the quality of the Model’s skills on prediction irrespective of what threshold has been chosen.
- A perfect model has an AUC-ROC of 1
- A random model has an AUC-ROC of 0.5
Log Loss
- Log Loss penalises false classifications
- Log loss is a measure of how close a prediction probability comes to the true value in classification.
- Best for multi-class classification.
- Log loss takes the probabilities for all classes present in the sample.
- , indicates whether sample belongs to class or not
- , indicates the probability of sample belonging to class
- Log Loss has a range of it thus has no upper bound limit, we can therefore say the loser it is to 0 the better the mode.
Regression
Mean Absolute Error
- Looks at average magnitude, in the same unit as the target.
- Less sensitive to outliers compared to MSE.
- Lower MAE = better performance, ()
Mean Squared Error
- MSE takes the average of the square of the difference between the original values and the predicted values.
- Good for computing the gradient.
- Good for when the target column is distributed around the mean.
- Can amplify outliers.
Root Mean Squared Error
- Quantifies the average magnitude of the errors or residuals.
- Measures how well predicted values align with actual values.
- Smaller RMSE indicate the model’s predications are closer to actual ones.
Coefficient of Determination
- Measures how well the model fits, how much the real values very from the regression line.
- ranges from , a value of 0 indicates no variance.
- The higher the value the better fit.
from sklearn.metrics import r2_score
r2 = r2_score(y, y_pred)
Root Mean Squared Log Error
- Usually used when we don’t want to penalise huge differences in the predicted and the actual values.
- These predicted and actual values are considered to be huge numbers.
Clustering
Adjusted Rand Score
- Calculates a share of observations for which these splits i.r.initial and clustering result is consistent.
- Where be the number of observations in a sample.
- to be the number of observation pairs with the same labels and located in the same cluster.
- to be the number of observations with different labels and located in different clusters.
Silhouette
The Silhouette distance shows up to which extent the distance between the objects of the same class differs from the mean distance between the objects from different clusters.
- The value lies between to
- If the value is closer to then it the clustering results are good.
- A value is closer to represents bad clustering.
Natural Language Processing
- BERTScore
BLEU
- Bilingual Evaluation Understudy
- Metric for machine translation tasks.
Cross-Entropy
Cross-entropy is a measure of the difference between two probability distributions for a given random variable or set of events.
- This computes the “surprise factor” of seeing a result.
- - true distribution of the data
- - distribution predicted by model
- The lower the entropy the better the model at matching true distributions.
Perplexity
- Language Model Evaluation
- Measures how well a model predicts a sample, it can capture the level of uncertainly.
- Lower values indicate better performance.